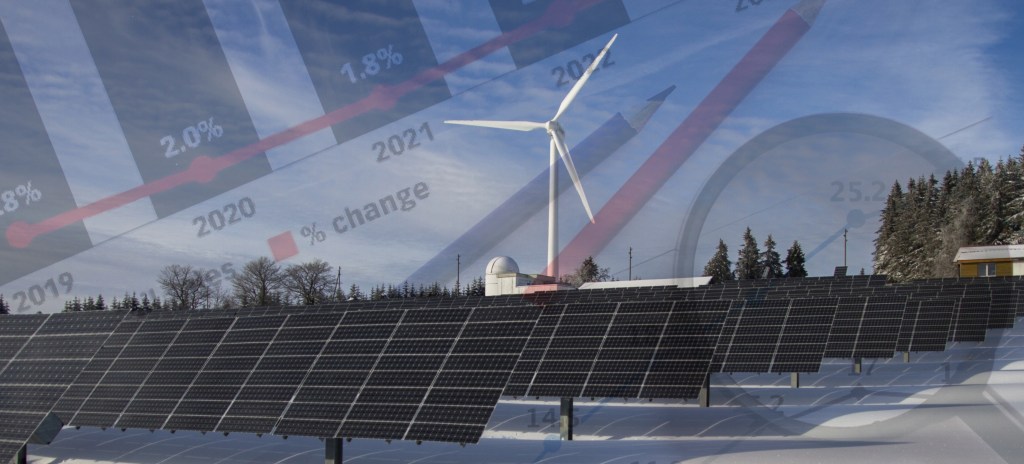
Welcome to Part 2 of our 3-part series where we explore the intriguing world of the Internal Rate of Return (IRR) through a real-world case study of a Solar + Battery Energy Storage System (BESS) project in Chile’s Atacama desert. In Part 1, we delved into the technical aspects, modeled DC energy production, and examined the intricacies of energy flow within our 11.25MWp system using the System Advisory Model (SAM) by NREL. If you missed Part 1, catch up here: Link to Part 1.
Part 2: Crunching the Numbers
In this installment, we shift our focus to the financial side of the project. We’ll dissect Capital Expenses (CAPEX), Operational Expenses (OPEX), and revenue generated from energy sales, both during the day and night.
CAPEX Evaluation: First up, we evaluate CAPEX at Year 0, just before the project commences. Our assumptions for this phase are:
- Solar CAPEX: $0.85 / Wp
- BESS CAPEX: $200 / kWh
OPEX and Revenue Assumptions: Next, we consider OPEX and revenue across the project’s lifetime (30 years). Our key assumptions include:
- Solar OPEX: $10,000 / MWp / year
- BESS OPEX: $1,000 / BESS unit / year
- OPEX Price Escalation: 2% / year (both Solar and BESS OPEX)
- BESS Price Drop: 0.5% / year (reflecting expected cost reductions in BESS systems)
- Land Lease: $2,500 / Hectare / year
- Insurance: 1% of revenue from energy sales
Energy Sales Pricing: The prices for energy sales (per MWh) are defined by the Power Purchase Agreement (PPA), assumed to be a 30-year agreement, and include any subsidies or incentives provided by the government. For this analysis, we use a Daytime Subsidized Energy Sale Price of $60 / MWh and a Nighttime Subsidized Energy Sale Price of $120 / MWh.
Graphical Insights
Now, let’s dive into the graphs and charts that depict our financial data.
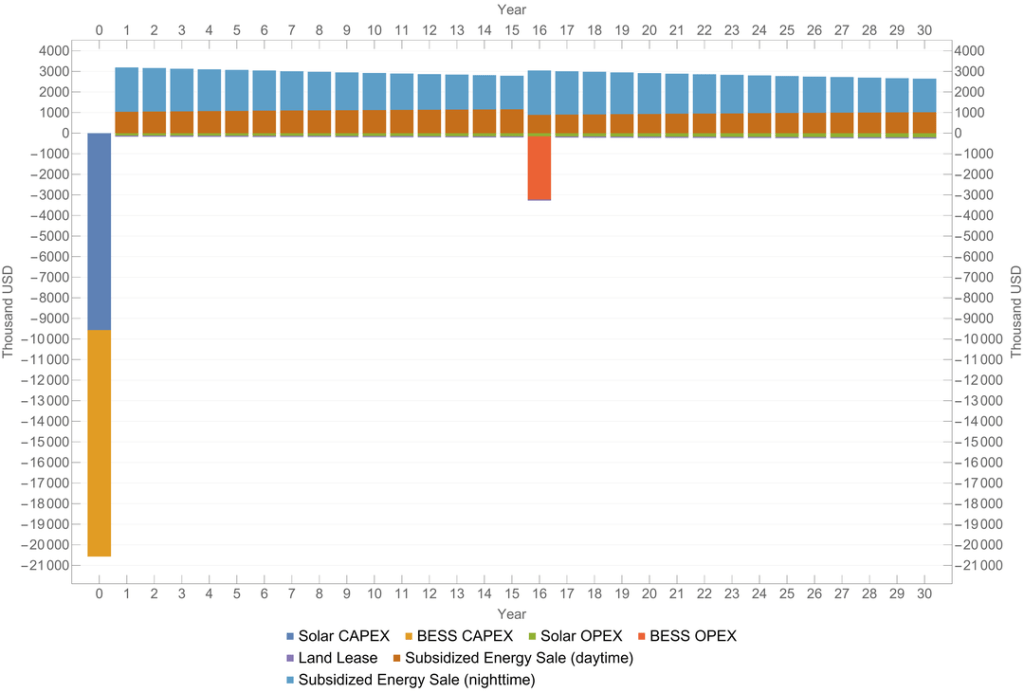
- Expense and Revenue Distribution: The first graph illustrates how capital investments and operational expenses evolve over time, alongside revenue from energy sales. Notably, Year 16 sees a significant investment to restore the BESS system’s efficiency to 100% after its End of Life (EoL).
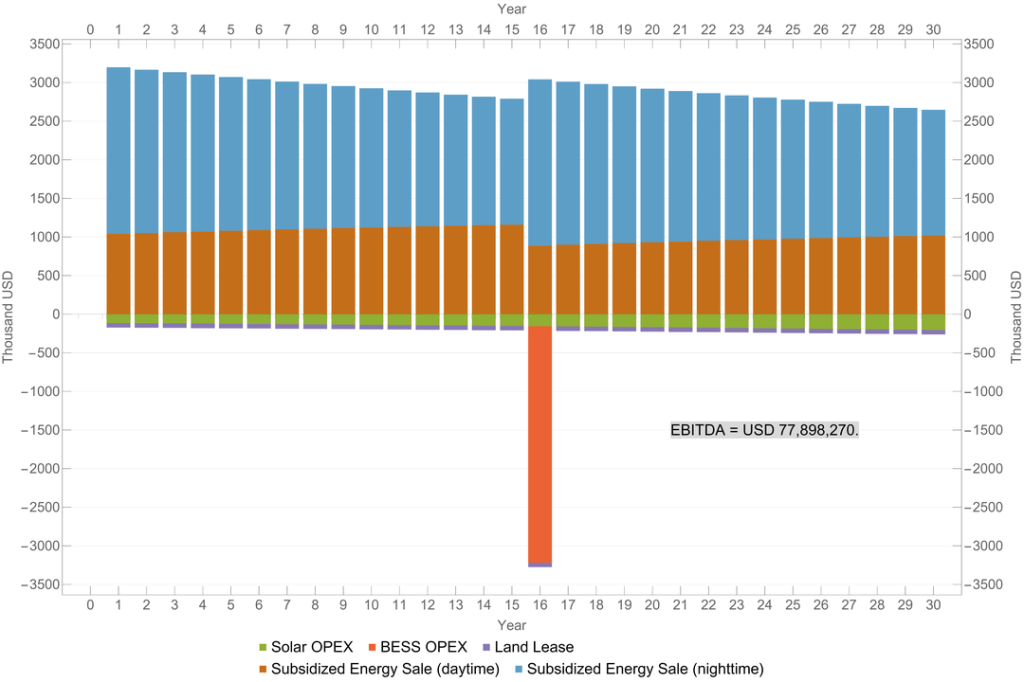
EBITDA Overview: The second graph offers a detailed breakdown of operational expenses and revenues across the project’s 30-year lifespan. The sum of these values gives us EBITDA (Earnings Before Interest, Taxes, Depreciation, and Amortization), which stands at approximately USD 78 million. EBITDA is a critical metric in assessing the financial health of the project.
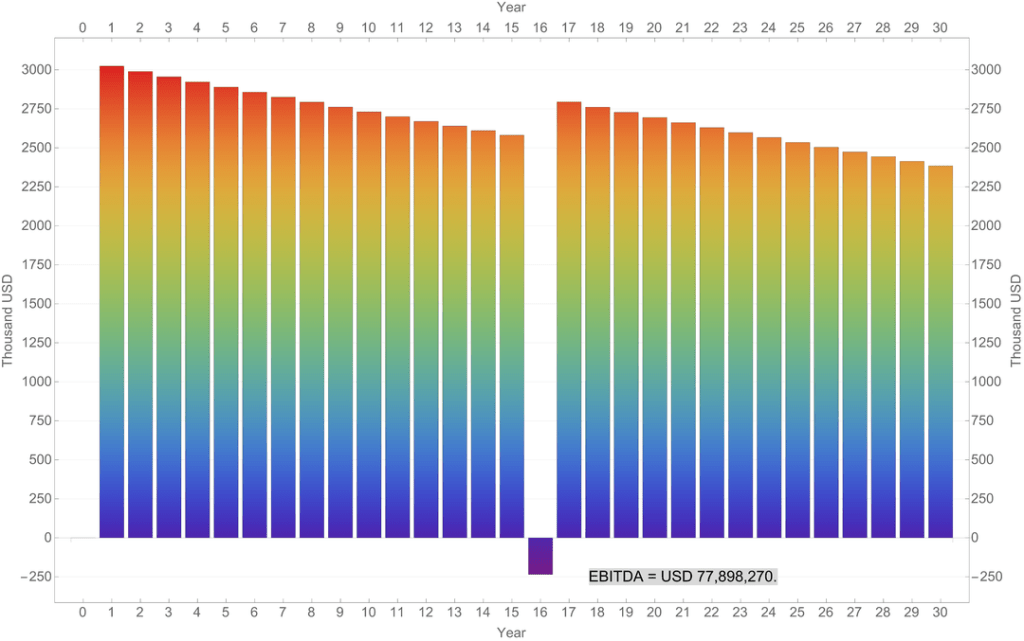
Yearly EBITDA Chart: Lastly, we present the EBITDA sums per year, without cost distribution. This chart provides a year-by-year snapshot of the project’s financial performance.
Stay Tuned for Part 3: Unveiling IRR Sensitivity Analysis
In Part 3, we’ll go deeper into the financial assessment by plotting the IRR of our project as a function of daytime and nighttime subsidized energy prices defined in the PPA. We’ll explore a range of energy prices ($20 to $200 per variable) and discuss how this data can guide our evaluation of the project’s financial feasibility.
Join me in the next installment as we unravel more about this project’s IRR and its impact on our Solar + BESS project in the Atacama desert of Chile!

Leave a comment