
A Simple Question With a Surprisingly Clear Answer
I’ve been working in solar long enough to notice a pattern.
Whenever I mention solar at a dinner table, one of three things happens:
- Someone says, “Yeah but it doesn’t really work, right?”
- Someone asks if it’s still worth it after incentives disappear
- Someone leans in and whispers, “So… does it actually make money?”
Fair questions.
So let’s talk about it – casually, honestly, and without the usual solar marketing fluff.
In this article, I’ll walk you through a realistic way a ~$10,000 out-of-pocket investment can translate into roughly ~$60,000 of positive cash impact within roughly six months, why that number isn’t magic, and when solar absolutely does not make sense.
No hype. No spreadsheets thrown at your face (okay, maybe a tiny one later). Just real talk.
Playing With the Numbers (and Breaking a Few Myths)
So I’ve been playing around with numbers lately for solar projects across North America, mainly in the US and Canada. Not just casually, but obsessively – the kind of obsessing that involves Excel being open at midnight while I convince myself that this is, in fact, fun.
I’ve been trying to understand what actually works and what doesn’t for solar and battery storage projects, and more importantly, at what scale they start to make sense. Around the same time, I took a course on optimization – the kind where you learn how to use tools in Excel to minimize or maximize an outcome given a set of constraints: profit, cost, efficiency, risk.
It was genuinely enjoyable, and it got me thinking: what would it actually take to make a solar project work? Somewhere? Anywhere?
Now, that question is obviously generic. There isn’t a single answer, and it’s definitely not one‑dimensional or purely about financing. You probably already guessed this, but the title of this article is a bit of clickbait – not in a bad way. Solar projects do work, and we’re going to see how surprisingly easy it is to prove that in a bit.
The second part of the title – the part about turning a profit – is also very real. Unfortunately, many people still don’t realize just how profitable investing in solar can be. Whether for better or worse, solar has been heavily marketed as a green, healthy, and sustainable solution. That’s all true, and it matters, but if I’m being honest, I think the conversation often starts in the wrong place.
Solar is a financial asset first.
Once that idea is anchored in someone’s mind, then we can talk about environmental benefits. Profitability, of course, is not universal. It depends heavily on the financing environment, local policies, and timing. But we can still look at a more‑or‑less generic commercial example in the US and see just how appealing solar projects can be, and how quickly they can turn profitable.
A Quick Policy Reality Check
A quick refresher on recent policy updates in the US. The OBBBA – the One Big Beautiful Bill Act – recently passed, and with it came some fairly radical changes for green energy projects. Most people would say these changes weren’t great, and I wouldn’t completely disagree. Others argue that tougher conditions will actually force green projects to become more resilient and economically sound in the long run.
I’m not here to decide who’s right. At the end of the day, you play the cards you’re dealt, and when life gives you lemons, you’d better be good with Excel.
Which brings me to my love‑hate relationship with Excel. I genuinely think it’s one of the most valuable pieces of software ever created in terms of what it enables people to do. At the same time, it definitely has its limitations, and when I hit those, I usually turn to coding languages that offer a wider scope for customization and optimization. For the purposes of this discussion, though, Excel is more than enough.
Commercial Solar Only (For Now)
Under the OBBBA, commercial solar projects installed within the next roughly six months are still eligible for the federal Investment Tax Credit (ITC). Residential solar, on the other hand, is more or less out of the federal incentive picture for now.
Everything we’re discussing here therefore applies specifically to commercial, behind‑the‑meter projects. I’m focusing on behind‑the‑meter systems intentionally, because they’re easier to define, easier to model, and easier for everyday business owners to relate to.
Let’s Make This Real
Imagine you own and operate a business with its own building. You have some roof space, and someone casually mentions that you could probably install solar panels up there and save some money in the long run. The natural question is: is it actually worth it?
Let’s look at the numbers. The answer, by the way, is almost always yes.
Assume you have enough space for roughly 90 to 100 solar modules, which translates to about 5,000 square feet of roof area. Yes – I’m very much looking at you, fitness center owners! Across most of the US, that system would come out to around 50 kW in size. At an installed cost of roughly $2.50 per watt, the total project cost lands at about $125,000.
If the system is installed within the current eligibility window, it qualifies for a 30% ITC. In some cases it can be higher, even reaching 50%, but let’s stay conservative. Because this is a commercial project, the system is also depreciable, which provides an additional tax shield.
Here’s where things start to get interesting. The energy produced by the system offsets electricity you would have otherwise purchased from the utility. Those savings are simply savings – they are not considered taxable income. Assuming net metering applies and that all generation offsets current or future consumption, you reduce your utility bill without creating a taxable revenue stream.
At the same time, the expenses associated with the solar system are very much tax‑deductible. In other words, you end up with a system that generates non‑taxable value in exchange for tax‑deductible expenses. It sounds too good to be true, but it’s very real.
So… How Do You Pay for It?
Of course, none of this matters if you can’t actually fund the project. The $125,000 has to come from somewhere. There are many financing options out there, and which one works best depends heavily on geography, incentives, and the specific business.
To keep things simple and accessible, we’ll assume the most straightforward option: a traditional bank loan. This is where things start getting interesting, because once you layer financing on top of incentives and savings, the numbers begin to tell a very compelling story.
Now, this all sounds very neat on paper, but the obvious question is: how do you actually finance a $125,000 project?
I’m not going to dive deep into every possible financing structure out there, simply because there are many, and they vary wildly depending on country, state, city, municipality, and even specific community programs. There are leases, power purchase agreements, on-bill financing, specialty lenders, incentive-backed loans – the list goes on.
For our purposes, we’re going to stick to something very simple and very accessible: a bank loan. Not because it’s the best option in every case, but because loans are fairly universal in both availability and structure, assuming the project fundamentals make sense.
To keep the example realistic, we’ll assume a $10,000 out-of-pocket down payment. In reality, there are financing structures that require little to no upfront capital and can cover close to 100% of project costs. That would change the profitability slightly – though, interestingly, not as much as you might expect, because solar economics are just that strong in this scenario. Still, adding a down payment makes the numbers more intuitive and easier to relate to.
We’ll assume a loan term of 10 years, even though longer tenors are often achievable in practice, and an interest rate of 6%. If that number feels optimistic or pessimistic to you, don’t worry – we’ll revisit it later.
Quick note: if any of the figures under this post look hard to read, you can right-click on them and open them in a new tab to view the full high-resolution versions!
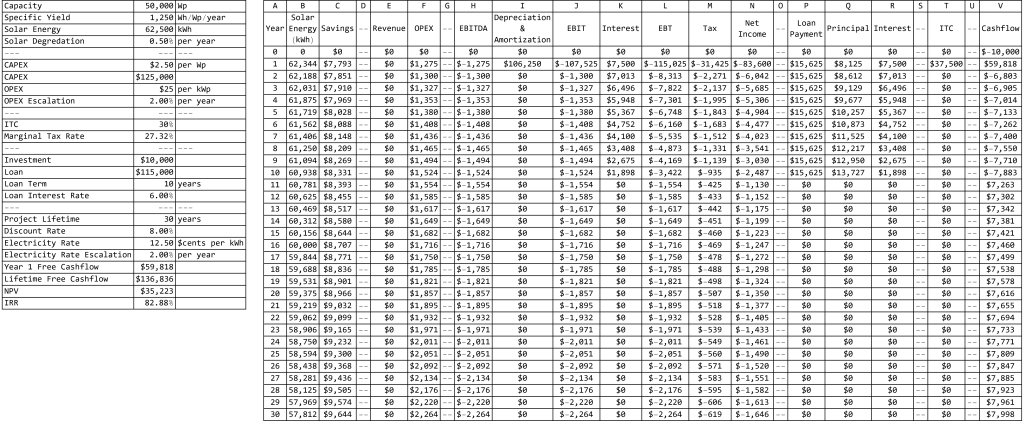
Figure 1: Base-Case Commercial Solar Financial Model (6% Loan Interest Rate): Cash-flow model for a 50 kW behind-the-meter commercial solar project in the US, assuming a 6% loan interest rate and a 12.5¢/kWh electricity offset. Note how project revenues remain zero (Column E), while value is captured through electricity savings (Column C). The most important output is cash flow (Column V), which shows a large first-year positive impact driven by the ITC and 100% bonus depreciation, followed by steady long-term performance.
At this point, it’s worth saying this explicitly: it’s perfectly fine if you don’t want to dissect every line of a financial model. You don’t have to. The most important metric in this entire analysis is cash flow (Column V).
Notice something subtle but critical: project Revenues are zero (Column E). The solar system is not selling electricity; it is offsetting electricity that would have been purchased from the utility. That value therefore appears as Savings (Column C) rather than revenue. This distinction matters because savings are not taxable, whereas revenues generally are.
Early in the project’s life, cash flow can be slightly negative because loan repayments are happening. Once the loan is paid off, the system starts generating clean, positive cash flow year after year. Over a 30-year system lifetime, the cumulative cash flow in this example lands at roughly $135,000.
That’s not bad by any conventional investment standard. But if I’m being honest, that’s also where most marketing presentations stop – and where I personally lose interest.
I don’t want to wait years to start getting paid. I want to get paid right away.
This is why the first year of operation matters more than almost anything else. As soon as the system is installed and placed into service, the tax incentives kick in. No one is cutting you a check, but the combination of the ITC and depreciation creates a tax write-off and tax shield of roughly $60,000.
Let that sink in for a moment. With a $10,000 out-of-pocket investment, the first year alone can generate a $60,000 positive cash impact. That’s the real meaning behind the “$10k to $60k” headline.
So what’s the catch?
There really isn’t one.
If you walk into a bank tomorrow, finance a commercial solar system for your business, and put roughly $10,000 down, you can realistically expect a tax benefit on the order of $60,000 when you file your taxes. That’s it. End of story.
Or so it seems.
Because there’s more.
And Then There Were More
What if you didn’t just want a massive first-year return, but also wanted the project to avoid negative cash flow entirely in every subsequent year? That’s where optimization comes in.
If we allow ourselves to tweak just two variables – the electricity rate you’re offsetting and the interest rate on your loan – we can analyze the conditions under which the project maintains positive cash flow every single year. While you don’t fully control either variable, understanding their impact helps identify which states, markets, and financing environments are inherently more attractive.
Quick note: if any of the figures under this post look hard to read, you can right-click on them and open them in a new tab to view the full high-resolution versions!
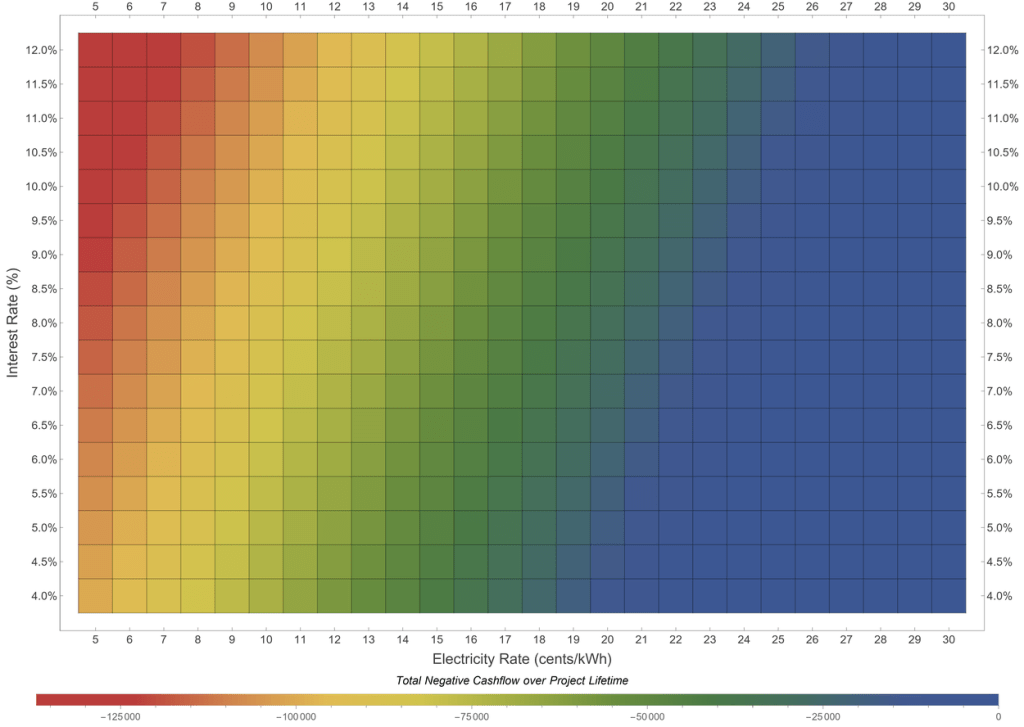
Figure 2: Sensitivity Analysis – Total Negative Cash Flow vs. Electricity Rate and Loan Interest Rate: Heatmap showing total cumulative negative cash flow over the project lifetime as a function of electricity rates (x-axis) and loan interest rates (y-axis). Warmer colors indicate worse outcomes, while cooler colors indicate minimal or zero negative cash flow. The plot highlights how higher electricity prices dramatically improve project resilience, even under higher interest rates, and explains why commercial solar is especially compelling in high-cost electricity markets.
When you plot negative cash flow as a function of electricity rates and loan interest rates, the goal is simple: push it as close to zero as possible. High electricity prices help enormously here. In places like California, where commercial electricity rates can reach 25 to 30 cents per kilowatt-hour, the model lights up with positive outcomes. Even at relatively high interest rates, consistent positive cash flow is achievable.
Quick note: if any of the figures under this post look hard to read, you can right-click on them and open them in a new tab to view the full high-resolution versions!

Figure 3: Stress-Test Case Commercial Solar Financial Model (9% Loan Interest Rate): Same project assumptions as Figure 1, but with a higher loan interest rate of 9% and higher electricity prices (27.5¢/kWh). Despite more expensive financing, the project remains cash-flow-positive in every year. This illustrates the robustness of commercial solar economics in high-electricity-cost markets and reinforces why cash flow, not headline IRR alone, is the most meaningful metric.
At around 27.5 cents per kilowatt-hour, for example, and even assuming a relatively high interest rate of 9%, the project still produces positive cash flow in every single year.
This is the moment where it’s important to step back and think about solar not emotionally, but objectively. Treat it like a black-box investment or a small standalone business. One that delivers a large upfront return through incentives, and then quietly pays itself off without requiring constant attention.
It’s not green technology at this point – it’s a golden goose.
And even in markets where electricity prices or financing terms aren’t ideal, the immediate return driven by incentives remains very real. We also haven’t even started optimizing other assumptions, such as system cost, operational expenses, higher incentive eligibility, or better-than-average solar yield. Every improvement on those fronts only makes the investment stronger.
A Final Reality Check
There is, however, a clock ticking. Under current rules, commercial solar projects in the US can only claim the ITC through the first half of 2026. After that, the OBBBA removes federal tax credits for solar. That won’t kill the industry – it never has – but it does make timing and optimization more critical than ever.
For transparency, I ran these numbers using Mathematica rather than Excel. Excel nearly gave me a heart attack once the tables and parametric scenarios got large. That said, working with code comes with its own risks, and after a few hours of staring at equations, your brain does start to feel like salad.
So if you spot anything odd, questionable, or flat-out wrong in the logic, I genuinely want to hear about it.
That’s how better models – and better projects – get built.
One last point worth emphasizing: these results are highly scalable. Larger commercial and industrial projects don’t just produce bigger absolute returns; they often benefit from lower per-unit costs, better financing terms, and operational efficiencies, which can make the economics even more compelling at scale.
Bonus: A deeper look into the Numbers, Assumptions, Metrics, and What They Actually Mean
Before wrapping this up, it’s worth taking a closer look at the assumptions behind the numbers used throughout this example, and clarifying a few technical terms that often get glossed over in solar discussions.
The system modeled here is a 50 kW commercial rooftop solar installation, producing about 62,500 kWh per year based on a specific yield of 1,250 kWh per kW per year. This is a conservative, widely achievable assumption across a large portion of the US. Panel degradation is assumed at 0.5% per year, consistent with modern module warranties and long-term field data.
On the cost side, total CAPEX is assumed at $2.50 per watt, resulting in a $125,000 project cost. Annual OPEXis modest, at $25 per kW per year, escalated at 2% annually to reflect inflation and maintenance cost growth. The project is financed with $10,000 in equity and a $115,000 loanover 10 yearsat 6% interest, with a total project lifetime of 30 yearsand a discount rate of 8%.
Electricity is valued at 12.5 cents per kWh, escalating at 2% per year. In many US markets, this is already conservative. As discussed earlier, higher electricity rates dramatically improve project robustness.
A few key definitions, in plain English:
- ITC (Investment Tax Credit): A federal tax credit that allows a percentage of the solar project’s capital cost (currently at a base of 30% for qualifying commercial projects) to be deducted directly from tax liability.
- Depreciation: An accounting mechanism that allows the cost of the solar system to be deducted for tax purposes, even though the asset is already installed and operating. Under current US tax rules, commercial solar projects are eligible for 100% bonus depreciation in year one, meaning the entire depreciable basis of the project can be written off in the first year it is placed in service. This dramatically increases early-year tax benefits and is a major contributor to the large first-year cash impact discussed earlier.
- EBITDA (Earnings Before Interest, Taxes, Depreciation, and Amortization): A measure of operating performance. In this case, EBITDA is negative by design, because the project generates savings instead of taxable revenue while still producing deductible expenses.
- Behind the meter: A solar system installed on the customer’s side of the utility meter, where electricity is consumed on-site first, directly offsetting utility purchases.
- Net metering / Net billing: Regulatory mechanisms that credit excess solar generation against future consumption. Net metering typically credits energy at the retail rate, while net billing credits it at a lower, avoided-cost rate.
Taken together, these assumptions explain how a relatively small upfront investment can produce an outsized first-year cash impact while remaining cash-flow-positive over the long term. None of this relies on aggressive modeling – it’s simply the result of understanding how incentives, taxation, and cash flow interact in real commercial solar projects.
Further Reading and Resources
If you want to go deeper into the mechanics behind these numbers, here are a few excellent resources worth bookmarking:
- NREL (National Renewable Energy Laboratory): For green financial modeling, NREL offers some of the best publicly available tools in the industry. Their System Advisor Model (SAM) includes robust Excel-based financial models that can be adapted to almost any type of solar project: https://sam.nrel.gov/financial-models.html
- Crux Climate: For insights into the OBBBA and its broader impact on solar and green energy projects, Crux provides clear, timely policy analysis. Their coverage of the One Big Beautiful Bill Act is a great starting point: https://www.cruxclimate.com/insights/one-big-beautiful-bill-act-passes-senate
- EnergySage: For up-to-date data on solar project costs, pricing trends, and market benchmarks, EnergySage’s insight and data reports are among the most widely referenced in the industry: https://www.energysage.com/data/

Leave a comment