
A while ago, I was working with a colleague trying to identify feasible, incentivized pathways for investing in solar (and solar + storage) across different U.S. states. This question has become especially relevant lately, with federal Investment Tax Credits (ITCs) for solar expected to begin phasing out within the next ~6 months.
During that exploration, I came across an interesting program offered by Duke Energy for its industrial customers in North Carolina (with a similar version in South Carolina). The program immediately caught my attention because it addresses one of the biggest bottlenecks in utility-scale solar development: interconnection permission from the utility.
In most states, you cannot simply decide to build a utility-scale solar project and connect it to the grid. That right is governed by specific utility-defined frameworks, market rules, and approval processes. Texas, for example, enables front-of-the-meter solar and BESS projects through the ERCOT market. Other states rely on community solar programs or feed-in-tariff-style structures.
If no utility or regulatory framework exists to define how a project interconnects and how it gets paid, then no matter how good the solar resource is, the project simply cannot exist.
That is what made this Duke Energy program interesting. It does provide a framework.
Duke Energy’s Green Source Advantage (GSA) Program
At a high level, Duke Energy’s Green Source Advantage (GSA) program allows large electricity consumers in North Carolina to support the development of new utility-scale renewable energy projects, primarily solar, while remaining connected to Duke’s grid.
In simple terms, an industrial or high-load customer (such as a manufacturing plant, data center, or large campus) participates in the program, while a developer or investor builds a front-of-the-meter solar project, typically up to about 5 MW, which is a meaningful project size by most standards. The project interconnects to Duke Energy’s grid under the GSA framework rather than behind the customer’s meter.
The financial structure is different from traditional behind-the-meter solar. The developer sells the solar energy into Duke’s system at a predefined PPA rate. Duke, in turn, provides the participating customer with a credit on their electricity bill that reflects the output of the solar project.
Practically speaking, the customer continues paying Duke for electricity as usual. They receive bill credits linked to the solar generation, while the developer relies on the PPA payments and incentives to make the project work financially.
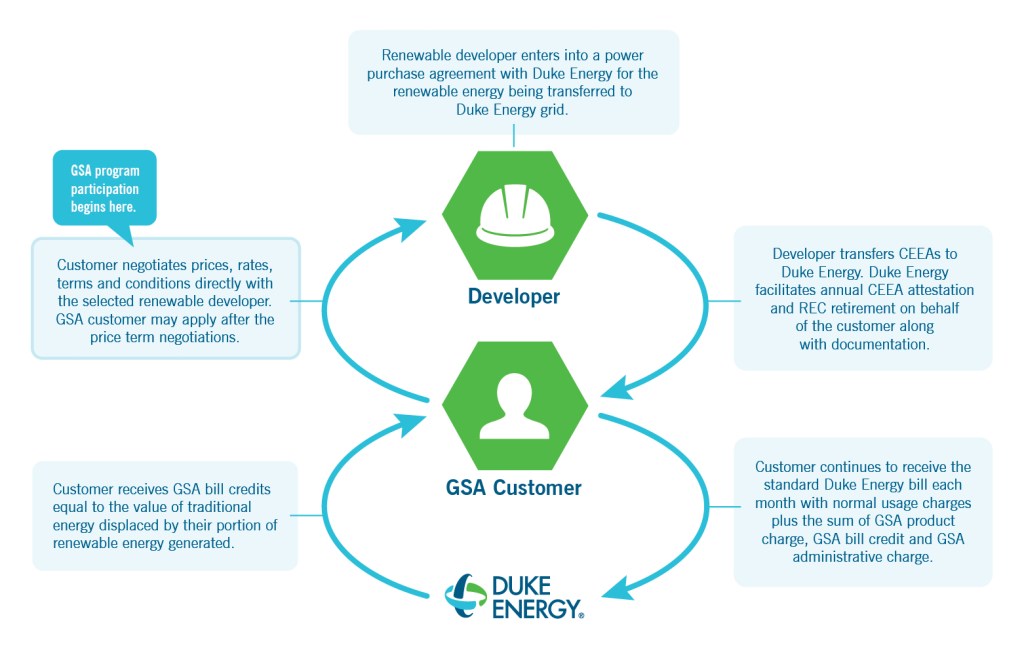
Simplified overview of how the Green Source Advantage program connects the customer, developer, and Duke Energy, and how energy and payments flow between them. Link to Program page: https://www.duke-energy.com/business/products/renewables/green-source-advantage
Renewable Energy Certificates (RECs) generated by the project are typically retained by Duke Energy. This allows Duke to meet sustainability and compliance objectives, while the customer can still claim participation in a green energy program depending on contractual terms. From a developer or investor perspective, it is important to note that RECs do not represent an additional revenue stream in this structure.
When I first reviewed the GSA program, I did a quick, high-level pass and decided to move on. This was not because the program was poorly designed, but because I was not convinced that the economics would justify the time and effort required to fully develop and model a project under it.
Recently, however, I found myself thinking about it again. This time, I wanted to give it a more disciplined review and answer a simple question: is this program actually investment-ready once the numbers are run properly?
Jumping In (and Making the Classic Mistake)
True to form, I got excited and jumped straight into building a detailed model. I modeled energy production, optimized equipment assumptions, researched financing structures used in comparable projects, and built out a comprehensive financial model.

In hindsight, this was unnecessary at that stage. A quicker, higher-level review would have revealed most of what I needed to know. That realization highlights an important distinction in how solar investments should be evaluated.
Project-Level vs. Equity-Level Modeling
When evaluating solar projects, there are typically two layers of financial analysis:
- A project-level model is where the evaluation should always begin. It answers fundamental questions such as whether the project generates enough revenue to cover its costs, whether cash flows are positive over the project’s life, and whether the project makes economic sense before any financing structure is applied. If a project does not work at this level, no amount of financial engineering can fix it.
- An equity-level model comes later and focuses on how investors are paid. This includes the mix of debt and equity, tax equity structures, leverage, and the resulting returns to investors. Equity-level modeling is useful only after the underlying project has already proven to be viable on its own.
In short, a weak project-level model cannot be saved by clever equity structuring.
Our Model
Before diving into the results, it is important to clearly frame what kind of project is being modeled and which assumptions truly drive the outcome.
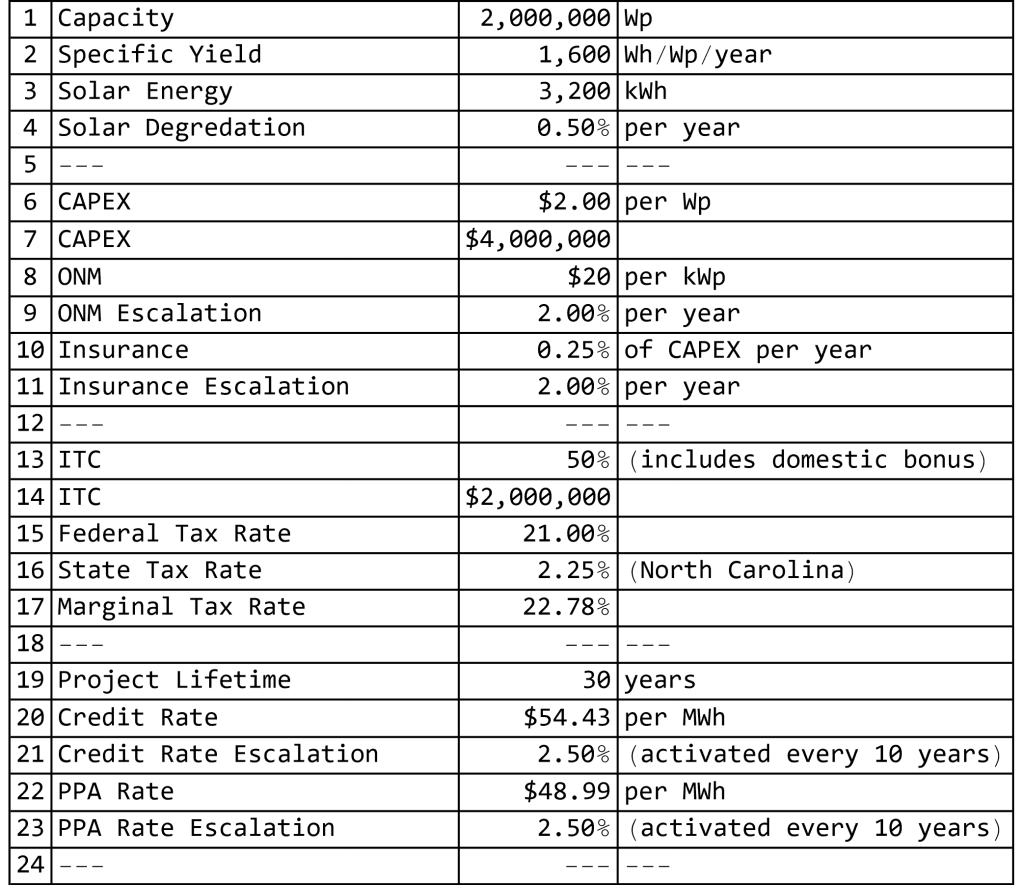
Key technical and financial assumptions used in the project-level model, reflecting realistic, market-aligned inputs rather than best-case scenarios.
First, this is modeled as a third-party ownership (TPO) structure. The developer owns, operates, and maintains the solar project for its full life. The customer does not invest capital and does not own the system. Instead, the customer acts as an enabler by allowing the developer to use available roof or site space to install a front-of-the-meter solar facility, with the expectation of capturing some level of savings through the program structure. From an investment perspective, all project risk and upside sit with the developer.
Second, the model assumes a total Investment Tax Credit of 50 percent. This includes the base ITC, the domestic content adder, and the energy community bonus. In practice, this assumption is not particularly aggressive. Domestic modules are currently available at a modest premium, often on the order of twenty to thirty cents per watt, which makes qualifying for the additional ten percent ITC relatively achievable. Site selection within an eligible energy community further supports this assumption.
A critical input to the model is the credit rate applied to the customer’s bill. This credit rate is not arbitrary. It is set by Duke Energy and is based on the utility’s avoided cost methodology. In simple terms, this represents Duke’s estimate of the value of energy and capacity that the solar project offsets on their system. For the purposes of this analysis, the avoided cost figures published by Duke Energy are used directly as the credit rate assumption. While the mechanics behind avoided cost calculations can be complex, the key point here is that this number is externally defined by the utility and largely outside the control of the developer.
Another important structural assumption relates to contract duration. The model assumes that the agreement between the developer, the customer, and Duke Energy is renewed every ten years. At each renewal, both the credit rate and the PPA rate are assumed to escalate by two percent. This reflects a reasonable long-term expectation that contracts will be periodically refreshed rather than locked in for thirty years at flat pricing.
Finally, the Power Purchase Agreement rate paid to the developer is assumed to be set at ten percent below the credit rate. This spread is intentional. By pricing the PPA below the credit rate, the customer captures the difference as direct savings. In other words, the customer receives credits from Duke that exceed what they effectively pay for the solar generation, creating a clear incentive to participate in the program and enter into the three-party agreement. From the developer’s perspective, this structure defines the revenue ceiling and becomes a key constraint on project economics.
These assumptions are not designed to stress-test extreme cases. They are meant to represent a realistic, market-aligned scenario that should work if the underlying program economics are fundamentally sound.
Results, and Where the Model Breaks
The first and most immediate red flag shows up in a single number: the Levelized Cost of Energy, or LCOE.
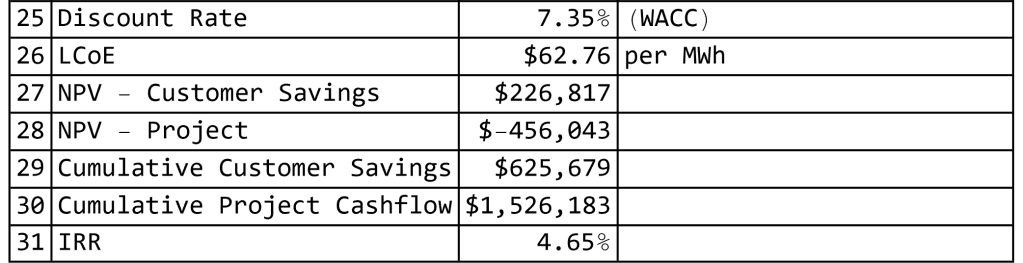
Summary of headline project outcomes, including LCOE, NPV, IRR, and customer savings under base-case assumptions.
In simple terms, LCOE represents the average cost of producing one megawatt-hour of electricity from the project over its entire lifetime. It rolls all major costs into a single value, including upfront capital expenditures, ongoing operating costs, degradation, and the time value of money. You can think of it as the minimum price at which electricity must be sold for the project to break even over the long run.
In this case, the modeled LCOE comes out materially higher than the PPA rate available under the Green Source Advantage structure. That alone is enough to signal trouble. If the cost of producing energy is higher than the price at which that energy can be sold, the project will structurally underperform. To simply break even, the PPA rate would need to be at or above the LCOE. Any price below that threshold guarantees value erosion rather than value creation.
Once that gap exists, the downstream results are unsurprising. The project-level Net Present Value is negative, indicating that the project destroys value over its life rather than creating it. In parallel, the Internal Rate of Return is very low, landing at a level that would not meet the minimum return requirements of most developers or investors, especially given the long-term operational and regulatory risks associated with front-of-the-meter assets.
What is particularly notable is that these results emerge despite relatively generous assumptions. The model includes a 50 percent Investment Tax Credit, reasonable escalation assumptions, and a customer-friendly structure that still preserves a revenue spread for the developer. Even under those conditions, the economics do not clear.
At that point, the conclusion becomes hard to escape. This is not a case where better financing, creative structuring, or marginal cost optimization will move the needle. The issue is structural. The revenue ceiling imposed by the avoided cost-based credit rate simply does not support the cost of building and operating the project.
In other words, the project does not fail because it is poorly designed. It fails because the math never really had a chance to work.
It is also important to point out that this does not mean no one benefits from the structure. In fact, the customer does quite well, which in itself is not a bad outcome. For projects like this to make sense in practice, all involved parties need to make money: the customer, the developer, and the utility.
The customer will make money as long as the PPA price they indirectly pay for the solar generation is lower than the credit rate they receive from Duke Energy. Under that condition, the difference shows up as direct savings or positive net present value for the customer. The utility, on the other hand, is almost always protected. Duke Energy has spent considerable effort designing this program so that it does not lose money, which is entirely reasonable. No utility or market participant can sustainably operate on negative cash flow.
The missing piece in this case is the developer or investor. Under the modeled assumptions, the project does not generate sufficient value for the owner of the asset. To illustrate this more clearly, we can look at how net present value shifts as the PPA price changes.
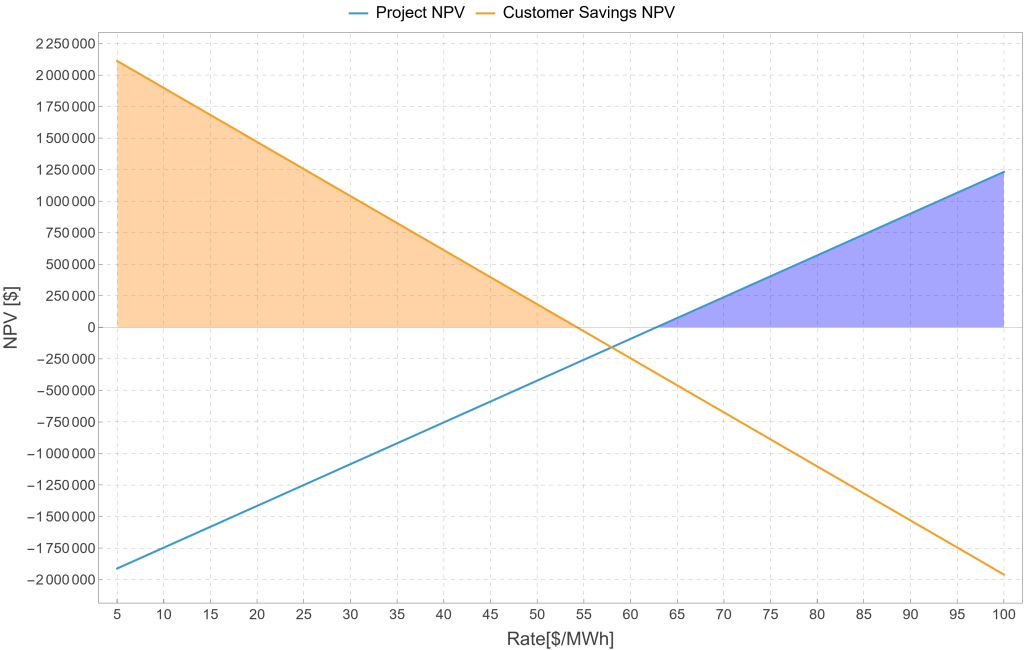
Net present value of customer savings and developer returns across a range of PPA prices, highlighting the lack of overlap where both parties are profitable.
When plotting customer savings NPV and project NPV across a range of PPA prices, an important pattern emerges. There are price levels where the customer is guaranteed positive savings, specifically whenever the PPA price is below the credit rate. There are also price levels where the developer would generate a positive project NPV, generally when the PPA price rises above the credit rate.
However, at no point do these two conditions overlap in positive territory. There is no PPA price at which both the customer and the developer achieve a positive net present value under the same set of assumptions. The curves simply do not cross above zero at the same time. This makes the problem clear and unavoidable. Given realistic costs and avoided cost-based credits, it is impossible for both parties to make money simultaneously.
This is ultimately why the project does not work. The structure successfully delivers customer savings and protects the utility, but it does so at the expense of the developer’s economics. Without a viable return for the party building and operating the asset, the project cannot move forward in practice.
Before moving on, it is worth briefly clarifying how to read the yearly cash flow numbers behind this analysis. This is a project-level model, not an equity-level one. That means no assumptions are made about debt, equity contributions, interest rates, or principal repayments. Interest expense and debt service are intentionally excluded.

Annual project-level cash flows over the full project life, excluding financing effects to isolate true economic feasibility. (zoom in for high-res view)
This does not make the results less realistic. On the contrary, project-level modeling is the correct starting point for assessing feasibility. If a project cannot stand on its own economically before financing, layering in debt or equity will not make it viable. A later equity-level analysis would simply redistribute the same underlying cash flows between lenders and investors, without changing the fundamental conclusion about whether the project works.
What Can Be Done? Extreme Measures Only (Bring Out the Magic Wands)
At this point, we are firmly in Harry Potter territory. No amount of careful spreadsheet work will fix the problem without a little financial magic. Think spells, cloaks, and perhaps a time turner rather than incremental optimizations.
Looking at the numbers, there is very little room left to maneuver. Under realistic assumptions, the project is structurally constrained by the gap between its cost of energy and the value that the program allows it to earn. Only extreme measures, bordering on unrealistic, could potentially move the needle.
One theoretical option is for the customer to accept a worse financial outcome. If the customer is highly motivated by sustainability goals, branding, or public image, they might be willing to pay a PPA price that is higher than the credit rate they receive from Duke Energy. In that case, the customer would knowingly give up savings in order to enable the project. While not impossible, this is a low-probability scenario and difficult to justify economically for most industrial customers.
Another lever is capital cost. Beyond program design, CAPEX is one of the few variables that directly affects project feasibility. However, there is limited flexibility here as well. Under an extreme assumption, one could imagine the project being built for around one dollar per watt or less. That would require exceptionally favorable equipment pricing, construction efficiencies, and site conditions.
Even then, the results are more revealing than reassuring. At that level, the economics do improve materially. The Levelized Cost of Energy drops below the PPA rate, which is the first and most important hurdle to clear. Once the cost of producing energy is lower than the price at which it can be sold, the project at least has a chance of working.

Project cash flows assuming an ultra-low installed cost of $1/Wp, illustrating the narrow conditions under which the project begins to work on paper.
Under this ultra-low CAPEX assumption, the project-level Net Present Value turns positive, although it remains relatively modest given the scale and duration of the investment. The Internal Rate of Return also improves meaningfully, reaching a level that begins to resemble what a developer or long-term investor might consider acceptable, especially for a contracted, utility-facing asset.
From the customer’s perspective, the outcome remains attractive. Customer savings stay solidly positive, since the PPA price is still set below the avoided cost-based credit rate. In other words, even in this extreme scenario, the customer benefits while the developer finally begins to see economic viability.
However, this result comes with an important caveat. Achieving a fully installed cost at or below one dollar per watt for a front-of-the-meter project of this size, under today’s market conditions, is highly optimistic. It would require near-perfect alignment of equipment pricing, construction efficiency, interconnection costs, and site conditions, with very little room for error.
This stress test does not so much rescue the project as it reinforces the earlier conclusion. The Green Source Advantage structure can work on paper, but only under conditions that are well outside what most developers would consider realistic. In practice, that makes the pathway narrow, fragile, and difficult to replicate at scale.
Final Takeaway
The takeaway from this exercise is not that front-of-the-meter solar cannot work in North Carolina, nor that Duke Energy’s program is flawed by design. Rather, under these specific conditions, the numbers simply do not line up in a way that makes the project trifecta-feasible for the customer, the developer, and the utility at the same time.
This is not about throwing shade at solar, utilities, or a state’s ability to host renewable projects. Sometimes things work. Sometimes they do not. That is perfectly fine. What is not healthy is carrying the flag of a mission, even a good one like decarbonization, and convincing ourselves that it must work no matter what.

Some projects pencil. Others do not. That is the beauty of numbers. As Shakira almost certainly said at some point, my numbers don’t lie (or something like that I can’t remember the exact lyrics!)

Leave a comment